How accurate is a LiDAR roof measurement?
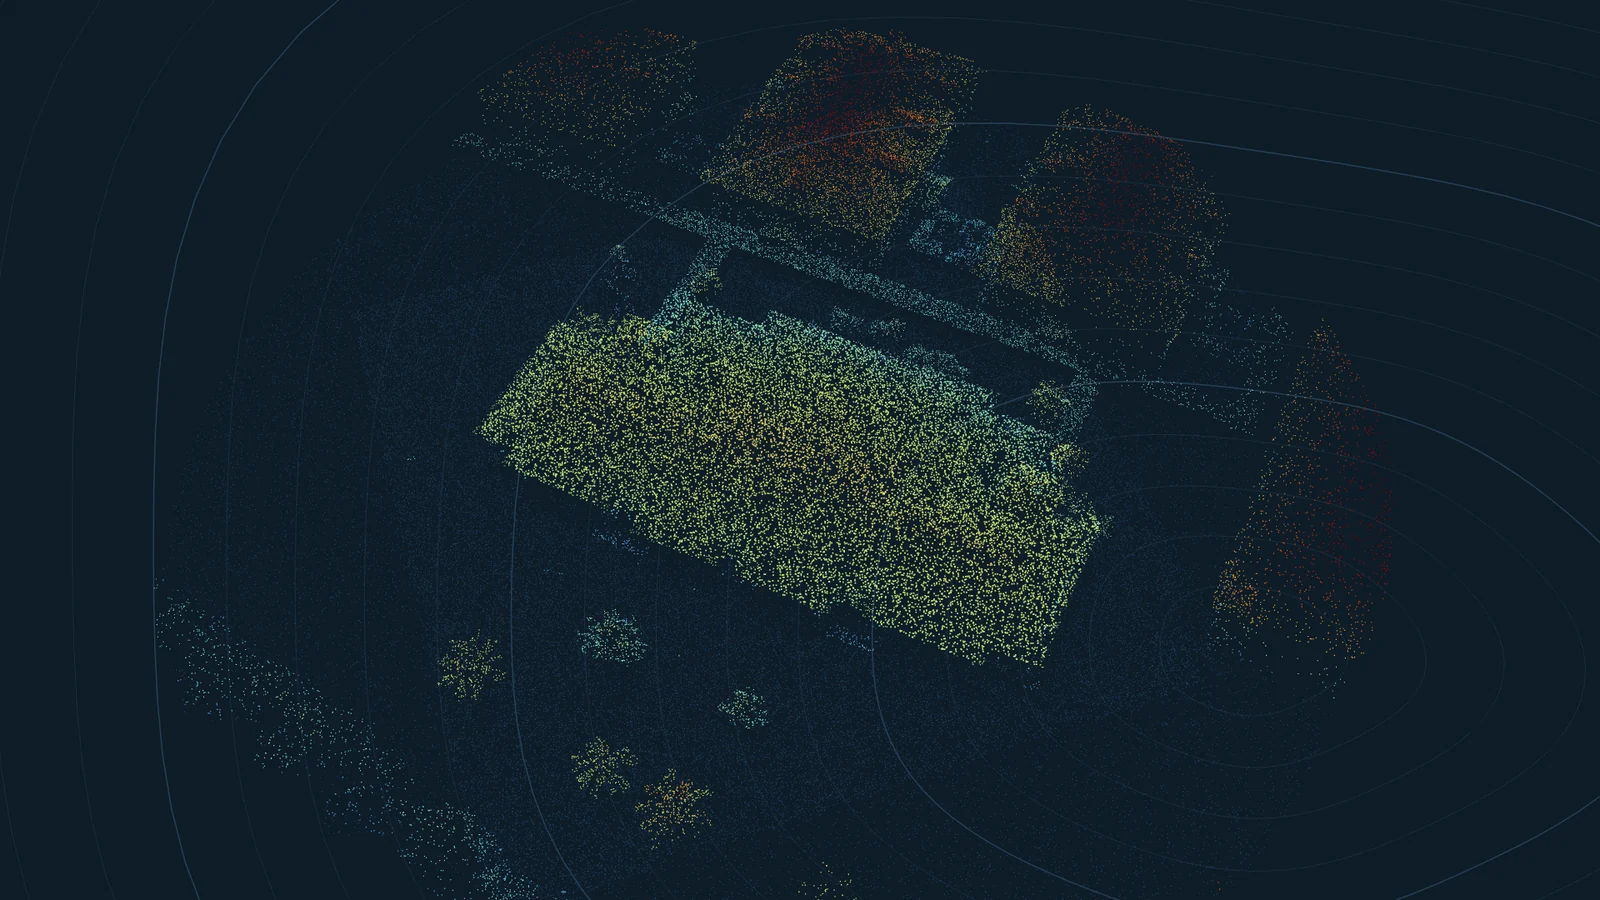
Much of the United States has been scanned from the air with LiDAR, a laser that records the height of the ground and everything on it, roofs included. The data is public. We built RoofTools on it and then checked it against paid aerial reports from EagleView, Roofr and RoofSnap.
The short answer
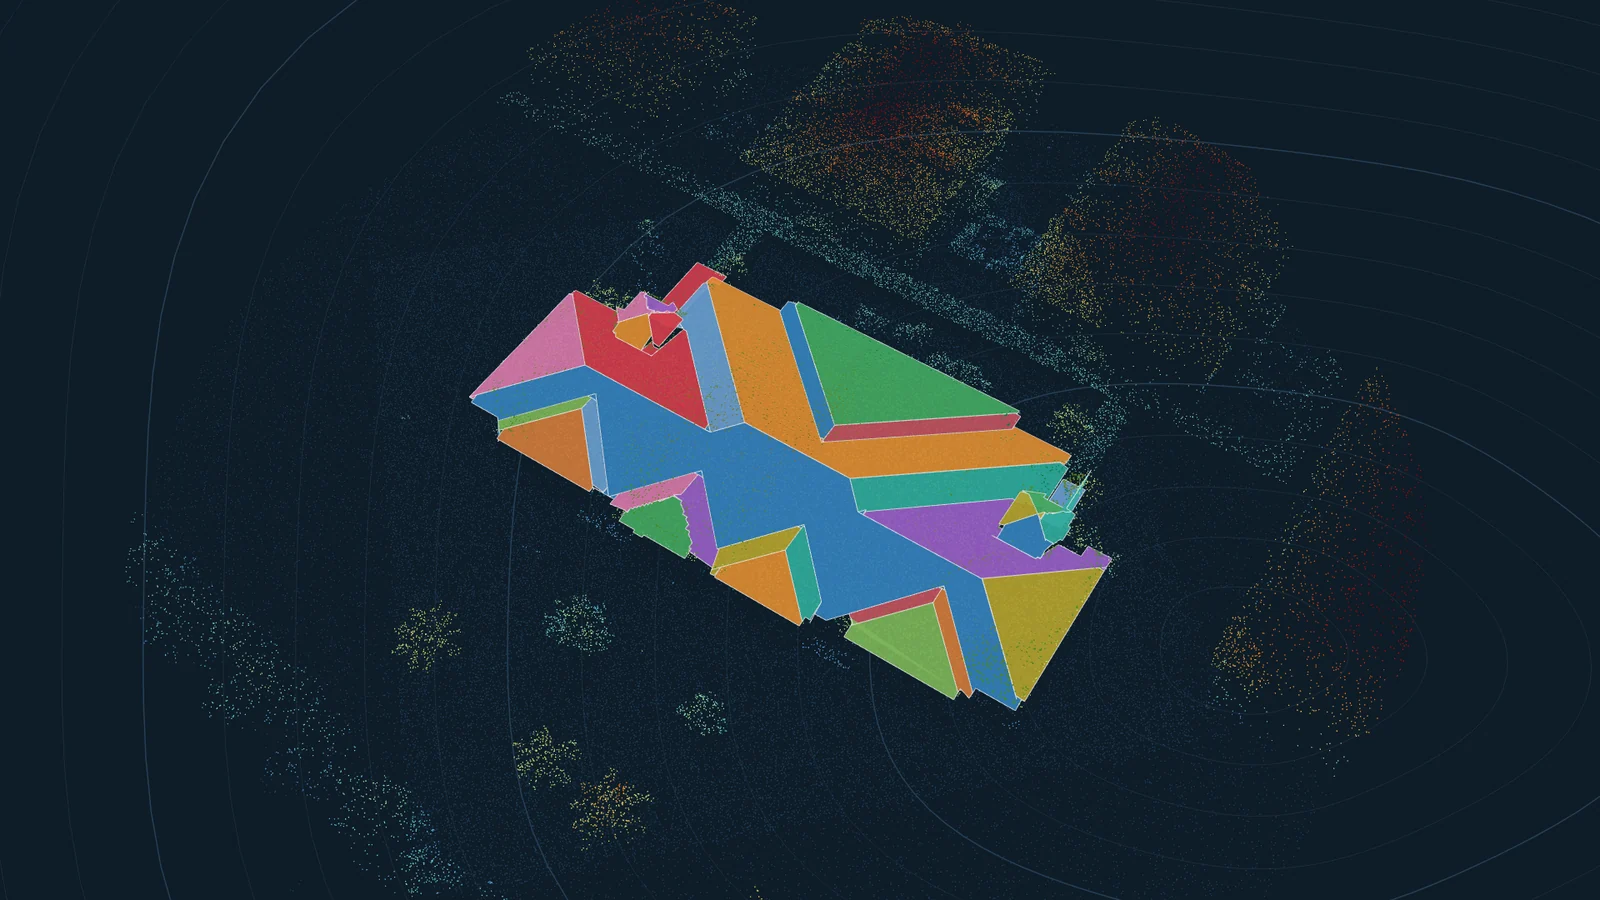
Total roof area came within 7.5% of the paid reports on all seven houses where the comparison was fair, with an average error of 5.1%. The main pitch was within 1/12 on every one. For scale, EagleView's own re-measurements of the same house differ by 1.5 to 3.6%.
Plane counts and edge lengths are weaker. Small facets get merged into their neighbours or lost, and ridge, hip and valley totals mostly come out short. That is why every RoofTools report opens in an editor where you can fix planes and edges over the photo.
The comparison
| House | Survey flown | Points per m2 | LiDAR area (sq ft) | Report area (sq ft) | Error | Pitch, LiDAR / report |
|---|---|---|---|---|---|---|
| Scottsdale, AZ | Nov 2020 | 26.9 | 4,485 | 4,691 | -4.4% | 5.8 / 7 |
| Rochester Hills, MI | Apr 2017 | 1.8 | 6,815 | 6,341 | +7.5% | 8 / 8 |
| Minneapolis, MN | May 2022 | 71.7 | 6,355 | 6,150 | +3.3% | 8 / 8 |
| College Station, TX | Jan 2017 | 2.6 | 3,790 | 3,915 | -3.2% | 5.7 / 6 |
| Coachella, CA (small) | Nov 2021 | 33.8 | 4,227 | 3,978 | +6.3% | 3.3 / 4 |
| Coachella, CA (walls) | Nov 2021 | 22.3 | 4,208 | 4,012 | +4.9% | 4.6 / 5 |
| Coachella, CA (large) | Nov 2021 | 24.6 | 7,276 | 6,831 | +6.5% | 3.9 / 4 |
Two more houses were left out of the average. In South Jordan, UT, the paid report measured a detached second building as well as the house. In Westerville, OH, the sample report covered a much smaller roof than the house at that address, and we could not tell which side was wrong.
What decides the accuracy
Point density. Newer surveys record 20 to 70 points per square metre, enough to see small dormers and crickets. Older ones can be as sparse as 2 per square metre, which still gives a good total area but blurs the smaller planes. Every RoofTools report shows the density and the survey it used.
Survey age. LiDAR is a snapshot. If the house was extended or re-roofed with a different shape after the flight, the measurement shows the old roof. The report prints the flight date so you can check it against the photo.
Trees. The laser passes through gaps in leaves, and RoofTools keeps only the points that form flat surfaces, so most overhanging branches drop out. A dense evergreen canopy right over the roof can still hide part of it.
Where the data comes from
RoofTools searches the USGS 3D Elevation Program, NOAA's Digital Coast, Kentucky's KyFromAbove and Connecticut's statewide survey, and picks the newest survey that covers the address. Coverage is best in the lower 48 states. Some counties have only older, sparser surveys, and a few have none yet.